Within each of the 11 “nations” of the U.S., rural and urban voters actually behave very similarly—but very differently from voters in other regional cultures
By Colin Woodard
For several years now, political journalists, analysts, and pundits have been arguing that U.S. politics has increasingly turned into a struggle between urban and rural voters. Regional differences were once paramount, Josh Kron observed in the Atlantic after the 2012 election. “Today, that divide has vanished,” he declared. “The new political divide is a stark division between cities and what remains of the countryside.” Two years later, the Washington Post’s Philip Bump wrote that there are “really two Americas; an urban one and a rural one,” going on to observe that since Iowa was growing more urban, Democrats could count on doing better there. Instead, an ever-more urbanized and diverse nation turned not just toward Republicans, but also toward the authoritarian nationalism of Donald Trump, prompting further hand-wringing over the brewing civil war. “It seems likely that the cracks dividing cities from not-cities will continue to deepen, like fissures in the Antarctic ice shelf, until there’s nothing left to repair,” concluded a lengthy New York story on the phenomena this April.
I don’t disagree that the United States is in crisis, with fissures breaking apart our facade of national unity and revealing structural weaknesses of the republic. Our federation — and, therefore, the world — is in peril, and the stakes are enormous. As the author of American Nations: A History of the Eleven Rival Regional Cultures of North America, however, I strongly disagree with the now-conventional narrative that what ultimately divides us is the difference between metropolitan and provincial life. The real divide is between regional cultures — an argument I fleshed out at the outset of this series—as it always has been. And I now have the data to demonstrate it.
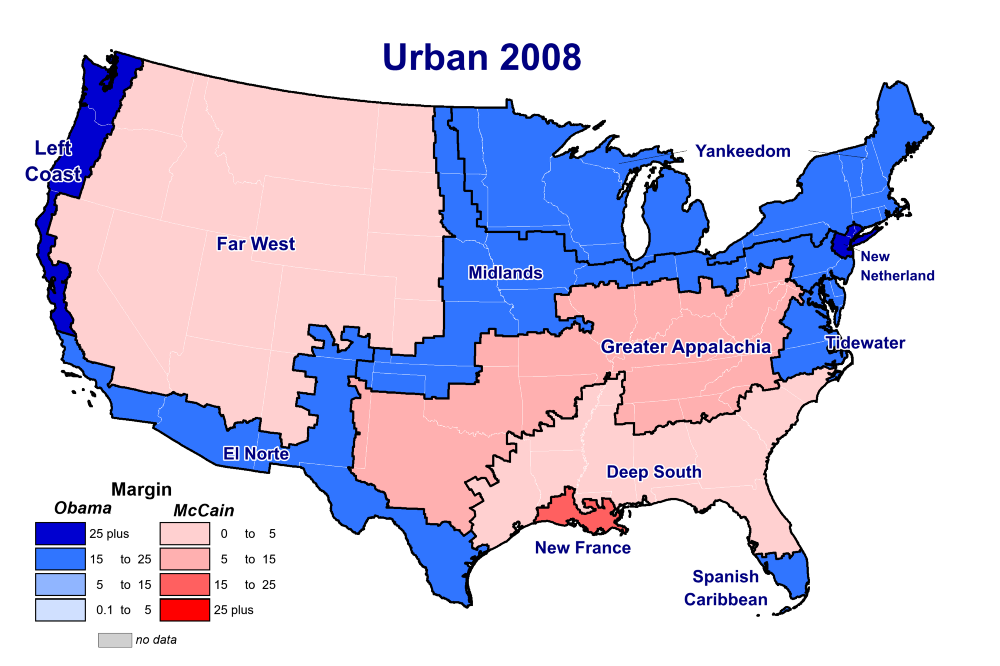
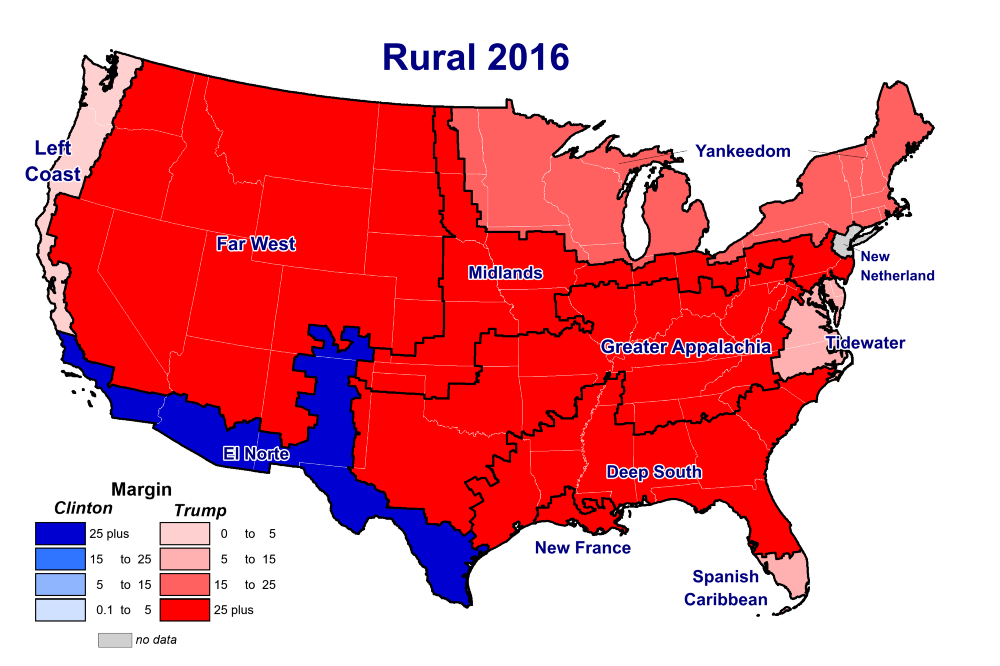
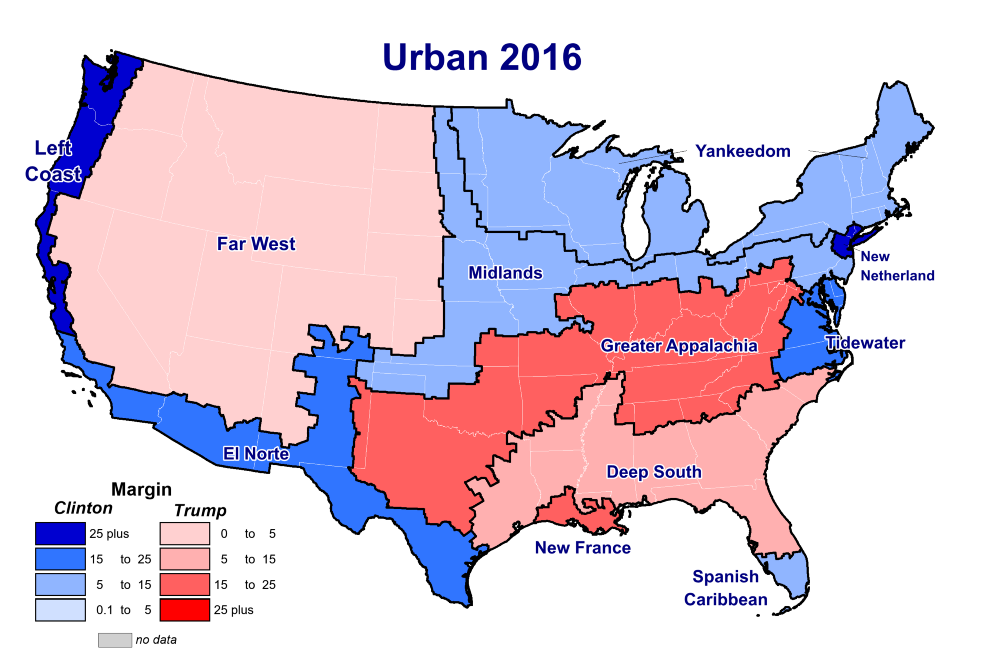
If the central political divide were really between rural and urban, trumping the regional cultural differences I outlined in American Nations, one would expect to see rural and urban counties voting for opposing candidates within each of the “nations.” A map showing rural results by nation would present us with a sea of reds, contrasting with urban results as a collection of blues. But that’s not the case at all. Instead, the data shows quite the opposite.
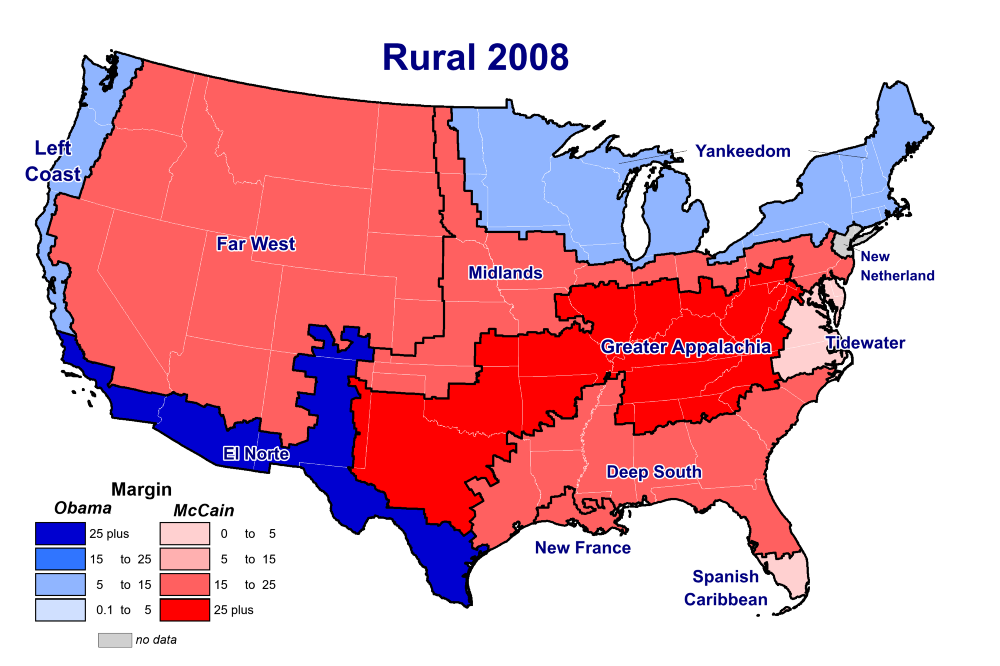
Working with one of my research collaborators, Will Mitchell of NBT Solutions, a digital mapping and geoservices firm in Portland, Maine, I sorted the county-level results of the past three presidential elections via both “nation” and the National Center for Health Statistics’ six-tiered urban-to-rural spectrum, which categorizes every U.S. county by level of urbanity, from those that form the core of major metropolitan regions (1) to the completely rural (6), allowing an examination of the full spectrum of political behavior. I then compared the results for each type of county within each nation, revealing the degree to which urbanity, sub-urbanity, and country life alters political behavior both within and between the regional cultures.
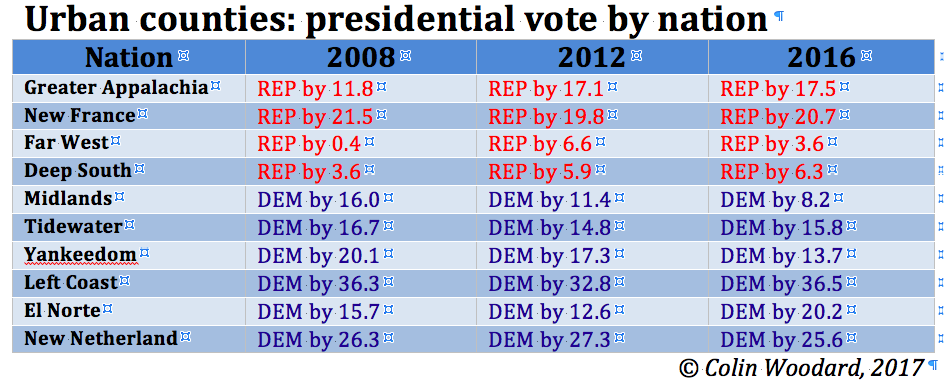
The top-level results compare urban (or “metropolitan”) counties — NCHS’s categories one through four — with rural (or “non-metropolitan”) counties, categories five and six. They deal a devastating blow to the urban versus rural thesis.
In five of the regional cultures that together comprise about 51 percent of the U.S. population, rural and urban counties always voted for the same presidential candidate, be it the “blue wave” election of 2008, the Trumpist storm of 2016, or the more ambiguous contest in between. In Greater Appalachia, the Deep South, Far West, and New France, rural and urban voters in aggregate supported Republican candidates in all three elections, whether they lived in the mountain hollers, wealthy suburbs, or big urban centers. In El Norte, both types of counties always voted Democratic, be they composed principally of empty desert or booming cityscapes.
In two more regional cultures — Yankeedom and the Left Coast — rural counties only recently became at odds with their urban neighbors who vote Democratic. They supported Barack Obama in 2008 by 5.9 and 10.5 percent margins, respectively. In the 2012 contest, rural Yankeedom was a toss-up (Romney’s margin there was 0.02 percent), while the rural Left Coast again supported Obama (by 5.6 percent). Only in 2016 did they defect to the Republicans, the rural Left Coast going for Trump by 2.7 points and rural Yankeedom by a shattering 18.3, for reasons I’ve previously discussed.
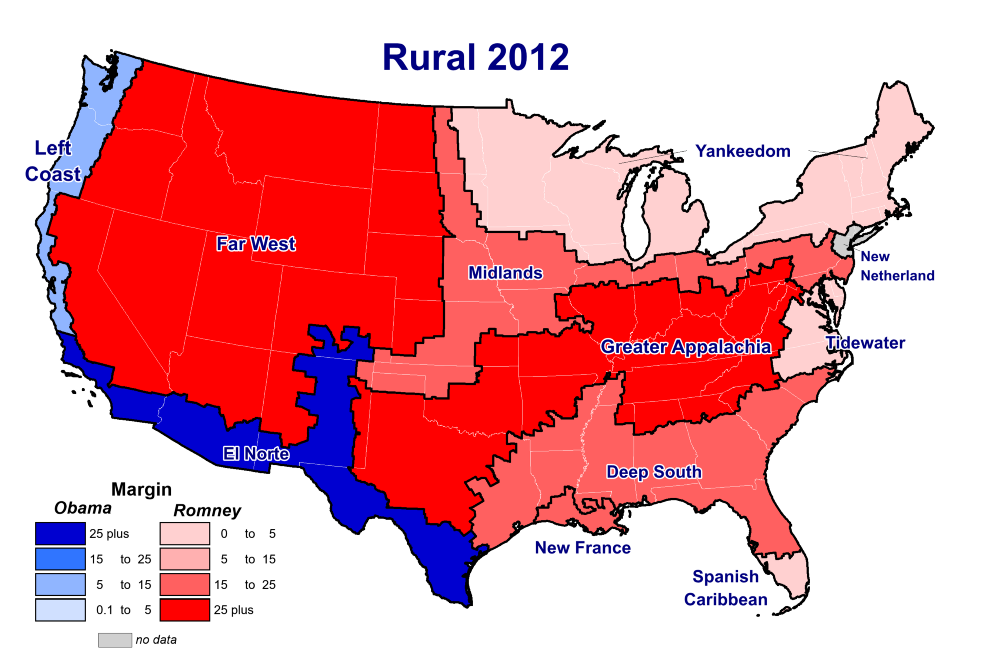
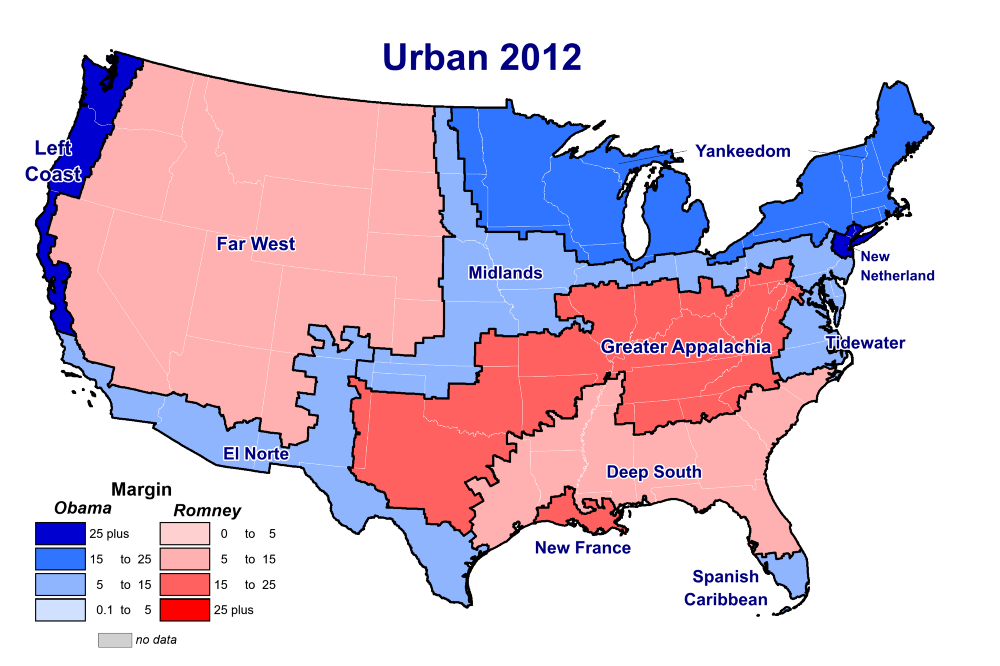
Indeed, only two regional cultures consistently exhibit rural versus urban vote splitting, and together they comprise just 15 percent of the U.S. population. In all three elections, urban Tidewater voted for the Democratic candidate (by 15 to 16 points), while rural Tidewater voted narrowly Republican (by 1.5, 3.6, and 10.7 points). Only in the Midlands, that great swing region of American politics, was the split a stark one; while urban Midlanders went for Democrats by between 6 and 18 points in the three elections, their rural counterparts voted Republican by 15.2, then 22.6, and finally a condemnatory 40.8 in 2016. The stark urban-rural divide in the country is to be found almost exclusively in the Midlands, where it has a disproportionate effect on the Electoral College, as that region straddles several historic swing states: Pennsylvania, Ohio, Iowa, and Missouri among them.
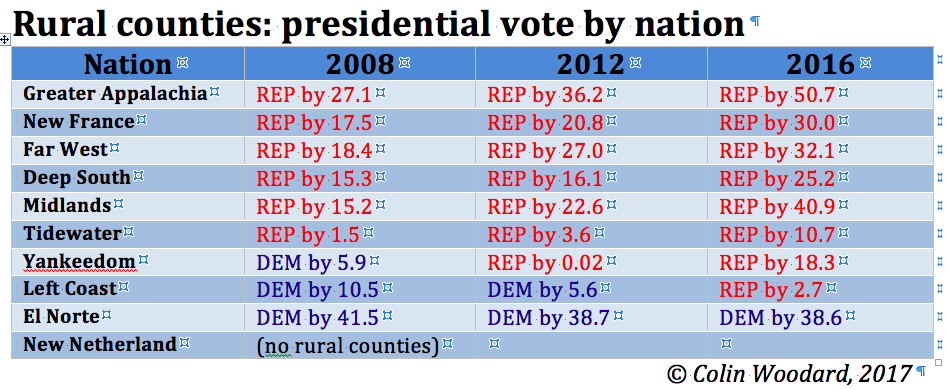
Note that these results do not include Hawaii (which, as part of the Greater Polynesia cultural area, lies outside my analysis), the southernmost part of Florida (part of the Spanish Caribbean area), or Alaska (which doesn’t release its election results by county), which means First Nation isn’t included in this analysis. (It’s overwhelmingly rural and Democratic, by the way.) It also omits New Netherland, because that small, densely populated nation has no rural counties at all.
That’s not to say that rural, suburban, and urban voters have the same political priorities — they absolutely do not, whether one lives in Thailand, the United Kingdom, or Colorado. But the differences between them are a secondary factor after deeper, wider cultural forces: the shared customs, beliefs, values, underlying assumptions, symbols, and stories that define and sustain the idea of being Thai or British or Far Western.
Consider the enormous variation between “nations” in the partisan margins among the United States’ most rural counties—the ones that don’t have so much as a town (or cluster of towns) with a population of 10,000 and are assigned to Category 6 by the NCHS.
In 2008, Obama won these extremely rural places in Yankeedom and essentially tied Mitt Romney in 2012. Despite the prevailing wisdom that white, rural, relatively poor voters are reliably Republican, huge swaths of rural, white, not-affluent northern New England, Upstate New York, and the upper Mississippi Valley voted for an African-American Democrat by large margins. In all three elections, Democrats won rural El Norte, and in 2008 they won the rural Tidewater as well; if there’s a divide in those latter regional cultures, it may be about race rather than density.

Nor are cities reliable bastions of Democratic support. The core counties of major metropolitan areas, like Phoenix, Jacksonville, and Virginia Beach — and lots of smaller ones, like Boise, Chattanooga, Corpus Christi, Mobile, Knoxville, Pensacola, Tulsa, and Wichita — voted Republican in every one of the past five presidential elections. But you know what they all had in common? Not a single one of them was located within Yankeedom, the Left Coast, or New Netherland, even though those three nations comprise 92 million people, or nearly 30 percent of the U.S. population. Dozens more voted Republican in many of these elections — including Houston (Harris County), Dallas (Dallas County), Salt Lake City, Colorado Springs, Charlotte, Omaha, Indianapolis, San Diego, Baton Rouge, Tampa, and Cincinnati — and, again, were located entirely outside those three nations, with one exception (Grand Rapids, Michigan, in Yankeedom).
Far from voting alike, all but the very largest cities behave like the regional culture they belong to. Take a look at counties belonging to medium-sized metros—those with a population of between 250,000 and 1 million—like Des Moines and Dayton, Charleston and Knoxville, Albuquerque and El Paso. Instead of being reliable blue bastions, such counties in four of the “nations” — Deep South, Far West, Greater Appalachia, and New France — collectively voted Republican in 2008, 2012, and 2016, and those in the Midlands did the same in the latter two elections. Only in Yankeedom, the Left Coast, New Netherland, and Tidewater — “blue” nations in these election cycles — were these medium-sized metros reliably Democratic. Cities turn out to be creatures of the cultures they are embedded in.

One sees the same trends in the 368 major metro “fringe” or suburban counties, the ones the CDC calls “category two.” These are counties that belong to a metropolitan area with a population of 1 million or more, but themselves include neither the core city nor at least a quarter-million people from any of the principal cities in the metro. These are places like Galveston County (in the Houston metro area), Arapahoe County (in greater Denver), Baltimore County (surrounding the city of the same name, or Montgomery County, Maryland, on the northern border of D.C., which has a population larger than a half-dozen states). Republicans won this class of densely populated, affluent counties in four nations in the past three presidential elections: Deep South, Greater Appalachia, New France, and — this one poignant, as it reveals something about the ethnocultural geography of the region — El Norte. Republicans also won them by a hair in the Far West in 2012. In Yankeedom, the Left Coast, New Netherland, and the Midlands, these nations voted Democratic in these contests.
In fact, the only counties where voters reliably support one party, regardless of what American Nation they are in, are the 68 in Category 1: the core counties in metropolitan areas with 1 million or more residents. These counties, which account for 30 percent of the U.S. population, collectively supported Democrats in each and every nation. But even here, there’s a catch: The margin of victory varies enormously depending on what nation these big core counties are in. In the past three elections, major cities in the Left Coast went for the Democratic presidential candidate by between 50 and 59 points, while the margins in Greater Appalachia were between 8 and 15.2 points. The Democratic margins in major metros in the Deep South — despite their racial diversity — were just 11.5 in 2008, 14.8 in 2012, and 9.8 in 2016, while the figures for New Netherland were 51.7, 53.5, and 57, respectively. (An interesting aside: Note that the biggest margins of all were in New France, where New Orleans (Orleans Parish) supported Democrats by more than 60 points in each election, even as the rest of that nation went for Republicans by solid margins.)
For now, please repeat after me: What divides Americans most of all isn’t the population densities of the places they live, but the centuries-old regional cultures to which they belong.